South Polar Stereographic Projection not producing right plot #350
Comments
|
Wow! The workaround really works. Thanks. |
Sign up for free
to join this conversation on GitHub.
Already have an account?
Sign in to comment
Hi,
This may be a followup of a previous closed issue (#118).
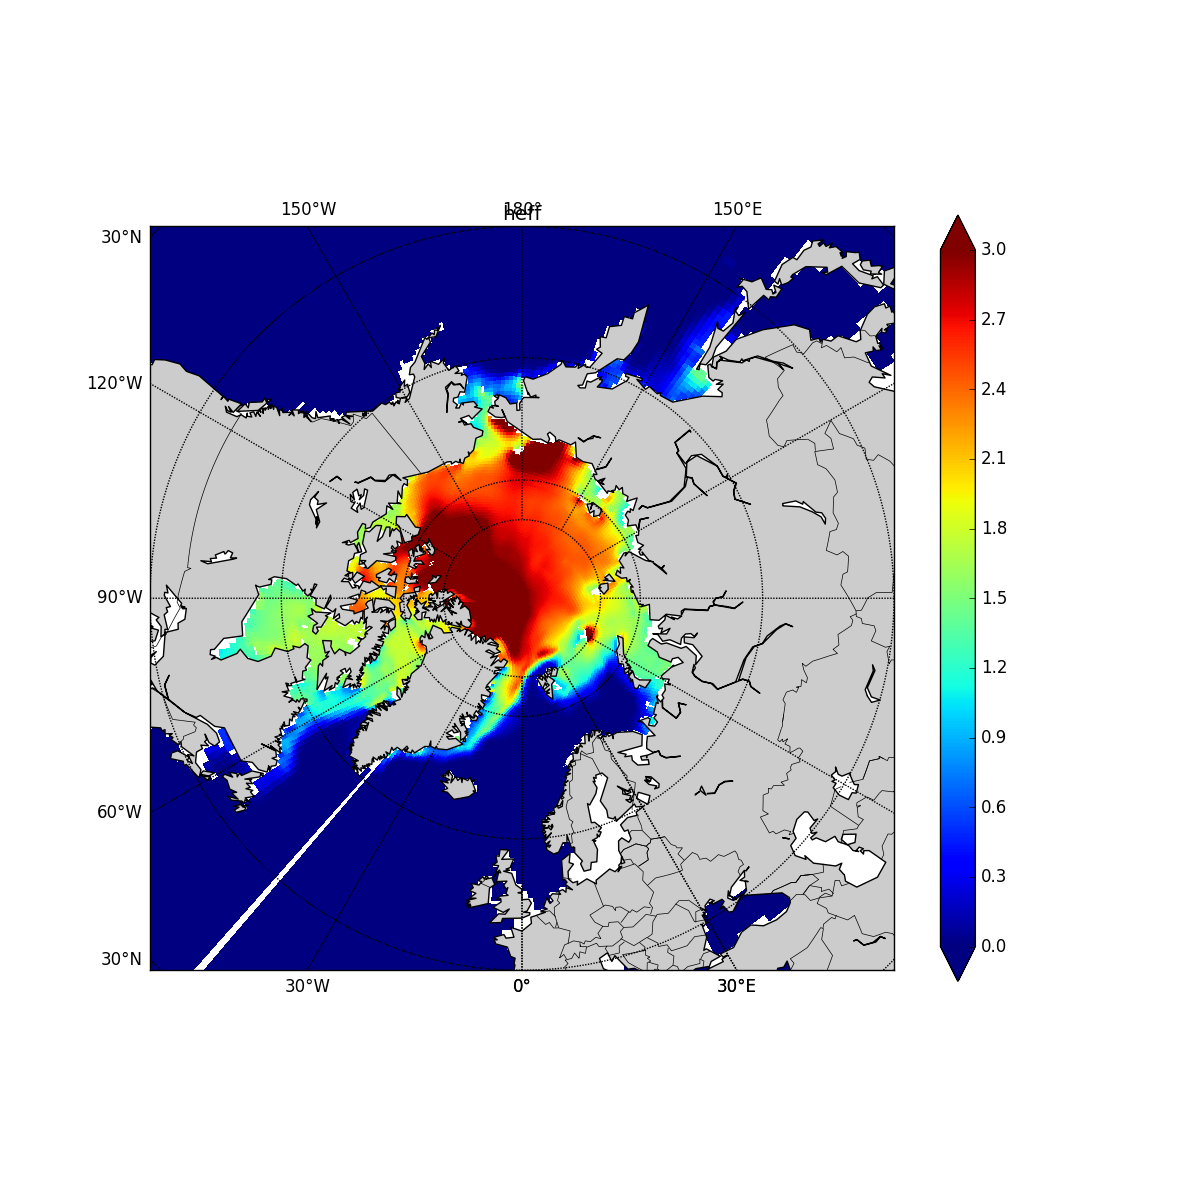
I am making polar stereographic projection pcolormesh plots of some sea ice data. It works fine with the Northern Hemisphere, but produces solid color for the South.
The problem was replicated on both Linux and Windows with different versions of Python, numpy, matplotlib and basemap. I am using basemap-1.1.0 with matplotlib-1.5.3 in winpython-3.5 on Windows 10 to produced the following figures.
Here is an example script:
A netcdf file to reproduce the problem can be downloaded here
ftp://pscftp.apl.washington.edu/zhang/Global_seaice/heff.H1987.nc.gz
Once untared, the following call to the above script (named plot_field_pole.py)
python plot_field_pole.py heff.H1987.nc heff S 0.0 3.0
will give the wrong plot.
while
python plot_field_pole.py heff.H1987.nc heff N 0.0 3.0
produced correct one.
The only difference between the two commands is Basemap(projection='spstere') or
Basemap(projection='npstere')
Any help will be much appreciated.
Bin Zhao
The text was updated successfully, but these errors were encountered: